Trendshift [CHE] StrategyTrendshift Strategy — First-Shift Structural Regime Trading
Profitfactor 2,603
Summary
Trendshift Strategy implements a structural regime-shift trading model built around the earliest confirmed change in directional structure. It identifies major swing highs and lows, validates breakouts through optional ATR-based conviction, and reacts only to the first confirmed shift in each direction. After a regime reversal, the strategy constructs a premium and discount band between the breakout candle and the previous opposite swing. This band is used as contextual bias and may optionally inform stop placement and position sizing.
The strategy focuses on clear, interpretable structural events rather than continuous signal generation. By limiting entries to the first valid shift, it reduces false recycles and allows the structural state to stabilize before a new trade occurs. All signals operate on closed-bar logic, and the strategy avoids higher-timeframe calls to stabilize execution behavior.
Motivation: Why this design?
Many structure-based systems repeatedly trigger as price fluctuates around prior highs and lows. This often leads to multiple flips during volatile or choppy conditions. Trendshift Strategy addresses this problem by restricting execution to the first confirmed structural event in each direction. ATR-based filters help differentiate genuine structural breaks from noise, while the contextual band ensures that the breakout is meaningful in relation to recent volatility.
The design aims to represent a minimalistic structural trading framework focused on regime turns rather than continuous trend signaling. This reduces chart noise and clarifies where the market transitions from one regime to another.
What’s different vs. standard approaches?
Baseline reference
Typical swing-based structure indicators report every break above or below recent swing points.
Architecture differences
First-shift-only regime logic that blocks repeated signals until direction reverses
ATR-filtered validation to avoid weak or momentum-less breaks
Premium and discount bands derived from breakout structure
Optional band-driven stop placement
Optional band-dependent position-sizing factor
Regime timeout system to neutralize structure after extended inactivity
Persistent-state architecture to prevent re-triggering
Practical effect
Only the earliest actionable structure change is traded
Fewer but higher-quality signals
Premium/discount tint assists contextual evaluation
Stops and sizing can be aligned with structural context rather than arbitrary volatility measures
Improved chart interpretability due to reduced marker frequency
How it works (technical)
The algorithm evaluates symmetric swing points using a fixed bar window. When a swing forms, its value and bar index are stored as persistent state. A structural shift occurs when price closes beyond the most recent major swing on the opposite side. If ATR filtering is enabled, the breakout must exceed a volatility-scaled distance to prevent micro-breaks from firing.
Once a valid shift is confirmed, the regime is updated to bullish or bearish. The script records the breakout level, the opposite swing, and derives a band between them. This band is checked for minimum size relative to ATR to avoid unrealistic contexts.
The first shift in a new direction generates both the strategy entry and a visual marker. Additional shifts in the same direction are suppressed until a reversal occurs. If a timeout is enabled, the regime resets after a specified number of bars without structural change, optionally clearing the band.
Stop placement, if enabled, uses either the opposite or same band edge depending on configuration. Position size is computed from account percentage and may optionally scale with the price-span-to-ATR relationship.
Parameter Guide
Market Structure
Swing length (default 5): Controls swing sensitivity. Lower values increase responsiveness.
Use ATR filter (default true): Requires breakouts to show momentum relative to ATR. Reduces false shifts.
ATR length (default 14): Volatility estimation for breakout and band validation.
Break ATR multiplier (default 1.0): Required breakout strength relative to ATR.
Premium/Discount Framework
Enable framework (default true): Activates premium/discount evaluation.
Persist band on timeout (default true): Keeps structural band after timeout.
Min band ATR mult (default 0.5): Rejects narrow bands.
Regime timeout bars (default 500): Neutralizes regime after inactivity.
Invert colors (default false): Color scheme toggle.
Visuals
Show zone tint (default true): Background shade in premium or discount region.
Show shift markers (default true): Display first-shift markers.
Execution and Risk
Risk per trade percent (default 1.0): Determines position size as account percentage.
Use band for size (default false): Scales size relative to band width behavior.
Flat on opposite shift (default true): Forces reversal behavior.
Use stop at band (default false): Stop anchored to band edges.
Stop band side: Chooses which band edge is used for stop generation.
Reading & Interpretation
A green background indicates discount conditions within the structural band; red indicates premium conditions. A green triangle below price marks the first bullish structural shift after a bearish regime. A red triangle above price marks the first bearish structural shift after a bullish regime.
When stops are active, the opposite band edge typically defines the protective level. Band width relative to ATR indicates how significant a structural change is: wider bands imply stronger volatility structure, while narrow bands may be suppressed by the minimum-size filter.
Practical Workflows & Combinations
Trend following: Use first-shift entries as initial regime confirmation. Add higher-timeframe trend filters for additional context.
Swing trading: Combine with simple liquidity or fair-value-gap concepts to refine entries.
Bias mapping: Use higher timeframes for structural regime and lower timeframes for execution within the premium/discount context.
Exit management: When using stops, consider ATR-scaling or multi-stage profit targets. When not using stops, reversals become the primary exit.
Behavior, Constraints & Performance
The strategy uses only confirmed swings and closed-bar logic, avoiding intrabar repaint. Pivot-based swings inherently appear after the pivot window completes, which is standard behavior. No higher-timeframe calls are used, preventing HTF-related repaint issues.
Persistent variables track regime and structural levels, minimizing recomputation. The maximum bars back setting is five-thousand. The design avoids loops and arrays, keeping performance stable.
Known limitations include limited signal density during consolidations, delayed swing confirmation, and sensitivity to extreme gaps that stretch band logic. ATR filtering mitigates some of these effects but does not eliminate them entirely.
Sensible Defaults & Quick Tuning
Fewer but stronger entries: Increase swing length or ATR breakout multiplier.
More responsive entries: Reduce swing length to capture earlier shifts.
More active band behavior: Lower the minimum band ATR threshold.
Stricter stop logic: Use the opposite band edge for stop placement.
Volatile markets: Increase ATR length slightly to stabilize behavior.
What this indicator is—and isn’t
Trendshift Strategy is a structural-regime trading engine that evaluates major directional shifts. It is not a complete trading system and does not include take-profit logic or prediction features. It does not attempt to forecast future price movement and should be used alongside broader market structure, volatility context, and disciplined risk management.
Disclaimer
The content provided, including all code and materials, is strictly for educational and informational purposes only. It is not intended as, and should not be interpreted as, financial advice, a recommendation to buy or sell any financial instrument, or an offer of any financial product or service. All strategies, tools, and examples discussed are provided for illustrative purposes to demonstrate coding techniques and the functionality of Pine Script within a trading context.
Any results from strategies or tools provided are hypothetical, and past performance is not indicative of future results. Trading and investing involve high risk, including the potential loss of principal, and may not be suitable for all individuals. Before making any trading decisions, please consult with a qualified financial professional to understand the risks involved.
By using this script, you acknowledge and agree that any trading decisions are made solely at your discretion and risk.
Do not use this indicator on Heikin-Ashi, Renko, Kagi, Point-and-Figure, or Range charts, as these chart types can produce unrealistic results for signal markers and alerts.
Best regards and happy trading
Chervolino
Cari skrip untuk "fair value gap"

lib_fvgLibrary "lib_fvg"
further expansion of my object oriented library toolkit. This lib detects Fair Value Gaps and returns them as objects.
Drawing them is a separate step so the lib can be used with securities. It also allows for usage of current/close price to detect fill/invalidation of a gap and to adjust the fill level dynamically. FVGs can be detected while forming and extended indefinitely while they're unfilled.
method draw(this)
Namespace types: FVG
Parameters:
this (FVG)
method draw(fvgs)
Namespace types: FVG
Parameters:
fvgs (FVG )
is_fvg(mode, precondition, filter_insignificant, filter_insignificant_atr_factor, live)
Parameters:
mode (int) : switch for detection 1 for bullish FVGs, -1 for bearish FVGs
precondition (bool) : allows for other confluences to block/enable detection
filter_insignificant (bool) : allows to ignore small gaps
filter_insignificant_atr_factor (float) : allows to adjust how small (compared to a 50 period ATR)
live (bool) : allows to detect FVGs while the third bar is forming -> will cause repainting
Returns: a tuple of (bar_index of gap bar, gap top, gap bottom)
create_fvg(mode, idx, top, btm, filled_at_pc, config)
Parameters:
mode (int) : switch for detection 1 for bullish FVGs, -1 for bearish FVGs
idx (int) : the bar_index of the FVG gap bar
top (float) : the top level of the FVG
btm (float) : the bottom level of the FVG
filled_at_pc (float) : the ratio (0-1) that the fill source needs to retrace into the gap to consider it filled/invalidated/ready for removal
config (FVGConfig) : the plot configuration/styles for the FVG
Returns: a new FVG object if there was a new FVG, else na
detect_fvg(mode, filled_at_pc, precondition, filter_insignificant, filter_insignificant_atr_factor, live, config)
Parameters:
mode (int) : switch for detection 1 for bullish FVGs, -1 for bearish FVGs
filled_at_pc (float)
precondition (bool) : allows for other confluences to block/enable detection
filter_insignificant (bool) : allows to ignore small gaps
filter_insignificant_atr_factor (float) : allows to adjust how small (compared to a 50 period ATR)
live (bool) : allows to detect FVGs while the third bar is forming -> will cause repainting
config (FVGConfig)
Returns: a new FVG object if there was a new FVG, else na
method update(this, fill_src)
Namespace types: FVG
Parameters:
this (FVG)
fill_src (float) : allows for usage of different fill source series, e.g. high for bearish FVGs, low vor bullish FVGs or close for both
method update(all, fill_src)
Namespace types: FVG
Parameters:
all (FVG )
fill_src (float)
method remove_filled(unfilled_fvgs)
Namespace types: FVG
Parameters:
unfilled_fvgs (FVG )
method delete(this)
Namespace types: FVG
Parameters:
this (FVG)
method delete_filled_fvgs_buffered(filled_fvgs, max_keep)
Namespace types: FVG
Parameters:
filled_fvgs (FVG )
max_keep (int) : the number of filled, latest FVGs to retain on the chart.
FVGConfig
Fields:
box_args (|robbatt/lib_plot_objects/36;BoxArgs|#OBJ)
line_args (|robbatt/lib_plot_objects/36;LineArgs|#OBJ)
box_show (series__bool)
line_show (series__bool)
keep_filled (series__bool)
extend (series__bool)
FVG
Fields:
config (|FVGConfig|#OBJ)
startbar (series__integer)
mode (series__integer)
top (series__float)
btm (series__float)
center (series__float)
size (series__float)
fill_size (series__float)
fill_lvl_target (series__float)
fill_lvl_current (series__float)
fillbar (series__integer)
filled (series__bool)
_fvg_box (|robbatt/lib_plot_objects/36;Box|#OBJ)
_fill_line (|robbatt/lib_plot_objects/36;Line|#OBJ)

Gaps + Imbalances + Wicks (MTF) - By LeviathanThis script will identify and draw price gaps, wicks and imbalances with customizable fill conditions, multi-timeframe function, zone size filtering, volume comparison, lookback filtering, as well as highly customizable appearance and settings.
I’ve made this indicator to combine the three similar but different elements that occur in price movements and serve as significant zones of interest or way of PA interpretation in various different strategies.
Imbalances (or Fair Value Gap/FVG/Inefficiency/whatever)
- The Imbalance “pattern” consists of 3 candles (1- candle before the sharp move, 2 - sharp move candle and 3- candle after the sharp move). When price makes a move downwards, the imbalance zone is defined as the area between the low of 1 and the high of 3 When price makes a move upwards, the imbalance zone is defined as the area between the high of 1 and the low of 3.
Gaps
A price gap is an area on a chart where no trading activity has taken place. A gap up means that the low of the current candle is higher than the high of the previous candle and a gap down means that the high of the current candle is lower than the low of the previous candle.
Wicks (or shadows/tails/whatever)
Wicks are used to indicate where the price has fluctuated relative to the opening and closing price of the candle. An upper wick is the zone between candle high and candle close/open (whichever is higher) and a lower wick is the zone between candle’s low and candle’s close/open (whichever is lower).
Settings Overview
“Zone Type” - This input lets you decide which zones should the script plot and on which timeframe. You should always pick a timeframe higher than your chat’s.
“Middle Line, Top Line, Bottom Line” - Show or hide the Middle Line (horizontal level in the middle of each zone), Show or hide Top Line (horizontal level at the top of the zone), Show or hide Bottom Line (horizontal level at the bottom of the zone)
“UP/DOWN Zones" - This input lets you show/hide UP Zones or DOWN Zones an pick their color, border color and label color.
”Fill Condition” - If turned ON, the zones will end drawing when your prefered Fill Condition is met (Full Filll = price mitigates the whole zone, Half Fill = zone is at least halfway mitigated and Touch = zone is touched by price). If turned OFF, the zones will only be plotted for the amount of bars defined it “Zone Length”.
”Lookback (D)” - This input lets you limit the amount of zones plotted on the chart by choosing how many days back in time should the script go to find and plot zones. For example, input 1 will only show you the zones of the past day, input 7 will only show you the zones of the past week.
”Hide Filled Zones” - If turned ON, the zones that have been filled will be removed from the chart.
”Show Boxes” - Show or hide the boxes that represent the zones. This is useful for those who want the zones to be visualized by just lines.
“Filter Type” - this input lets you create a filter that will make the script only show zones that are larger than ATR or larger than a certain percentage. You can choose the ATR Length and the multiplier (higher multiplier → larger zone required), as well as the Percentage (%) and its multiplier (higher percentage → larger zone required). If you choose “None”, the zones of all sizes will be plotted.
”Zone Labels” - this part of the settings lets you: show/hide labels, decide on the size of the labels and their positions, choose a custom name for each zone, choose the data that the labels present (Type of the zone/Timeframe/ Volume ).
”Other settings” - ‘Stop/Delete zone after X number of candles’ will force stop/delete the zone if it’s plotted for more than prefered number of bars. ‘Line Style’ lets you choose the style and the color of the lines, ‘Zone Length’ defines the length of the zone if Fill Condition is “None”.
More settings, modifications and improvements coming in future updates. This script is a bit old so I will clean up and optimize the code once I have more time.

Trend Line & Delta Montosca [English v33.7]This indicator, Trend Line & Delta Montosca , is a high-precision tool designed to identify institutional entry points by combining price action structure with real-time volume sentiment (Order Flow).
Here is a breakdown of its core logic and operational flow:
1. Market Structure & Trendline Analysis
The indicator starts by identifying "Pivot Highs" and "Pivot Lows" based on the Sensitivity settings you chose.
Pivot Connect Method: It draws trendlines connecting these key structural points. A "Long" bias is established when a trendline is broken to the upside, and a "Short" bias when broken to the downside.
BOS (Break of Structure): It monitors when the price closes above the previous high or below the previous low to confirm the current market phase (Bullish or Bearish).
2. Intermarket Synchronization (ES + NQ)
This is a unique "Institutional" filter. The script checks a secondary symbol (e.g., NQ if you are trading ES) to ensure the move is happening across the entire market.
If both instruments hit a pivot at the same time, the trendline is drawn thicker, indicating higher institutional conviction.
3. Order Flow Validation (Delta)
Breaking a trendline is not enough; it must be backed by "Smart Money" volume. The indicator uses Lower Timeframe (LTF) Intrabar Data to calculate the Delta:
Strength Filter: It checks if the buying/selling volume in a single candle exceeds a specific percentage (set to 75% by default).
Efficiency Filter: It identifies "Absorption" where the price moves aggressively with lower volume, suggesting a lack of resistance.
4. Inverted FVG (Fair Value Gap) Reaction
The final "trigger" is often the reaction to a Fair Value Gap.
The script tracks bearish and bullish FVGs.
The Inversion Logic: A "Long" signal is only validated if the price "inverts" a bearish FVG (closes above it), treating the old resistance as new institutional support.
5. Blue Sky Filter (ATH)
When the price is at an All-Time High (ATH), traditional FVG reactions might not exist. The script includes an optional "Blue Sky" logic that allows for trend-following entries even if there is no previous FVG to invert, as long as the structural breakout and Delta are present.
Visualization Summary
Labels: Clearly mark "LONG" or "SHORT" at the exact candle of entry.
Snapshots: To help you review your trades, the script leaves a "visual footprint" (the trendline and the FVG box) that caused the signal, so you can see the exact institutional context after the trade has moved.

TimeframeAlignTHE PROBLEM THIS LIBRARY SOLVES
When you use `request.security()` to get data from a Higher Timeframe (HTF) and try to draw objects like boxes, lines, or labels, they appear at the wrong horizontal position . This is the "floating in space" problem.
Why does this happen?
The `bar_index` in Pine Script refers to where data was RECEIVED , not where the event OCCURRED .
Consider this scenario:
• You're on a 5-minute chart
• You request 1-hour data for drawing an FVG (Fair Value Gap)
• A 1H candle spans 12 chart bars (60min / 5min = 12)
• But your code draws at `bar_index - 1` or `bar_index - 3`
• The result: your FVG box is only 2-3 bars wide instead of spanning the correct 12-36 bars
This library solves that by tracking where HTF bars actually start and end on your chart timeframe.
━━━━━━━━━━━━━━━━━━━━━━━━━━━━━━━━━━━━━━━━━━━━━━━
HOW TO USE THIS LIBRARY
Step 1: Import the Library
```
import ArunaReborn/TimeframeAlign/1 as tfa
```
Step 2: Create a Tracker for Each HTF
```
var tfa.HTFTracker tracker1H = tfa.createTracker("60")
```
Step 3: Update the Tracker Every Bar
```
tfa.updateTracker(tracker1H, "60")
```
Step 4: Use Synced Drawing Functions
```
if tfa.htfBarChanged(tracker1H)
tfa.syncedBox(tracker1H, 3, 1, topPrice, bottomPrice, color.new(color.green, 80))
```
━━━━━━━━━━━━━━━━━━━━━━━━━━━━━━━━━━━━━━━━━━━━━━━
EXPORTED TYPES
TimeframePair
Stores metadata about the relationship between source and chart timeframes.
• sourceTimeframe - The HTF/LTF being compared
• chartTimeframe - Current chart timeframe
• isHTF - True if source is higher than chart
• isLTF - True if source is lower than chart
• barRatio - Chart bars per source bar
• secondsRatio - Time ratio between timeframes
MTFEventData
Stores synchronized event data with correct bar positions.
• price - Price level of the event
• eventTime - Unix timestamp of the event
• chartBarStart - Chart bar_index where event's TF bar started
• chartBarEnd - Chart bar_index where event's TF bar ended
• htfOffset - The HTF offset used
• isValid - True if synchronization succeeded
HTFTracker
Tracks HTF bar boundaries. Create one per timeframe you need to track.
• htfTimeframe - The timeframe being tracked
• currentStartBar - Where current HTF bar started
• currentEndBar - Where current HTF bar ends (provisional)
• startHistory - Array of historical start positions
• endHistory - Array of historical end positions
• lastUpdateBar - Last bar_index when updated
• barJustChanged - True if HTF bar changed on this chart bar (set by updateTracker)
SyncedBox
Managed box with synchronization metadata.
• bx - The Pine Script box object
• htfTimeframe - Source timeframe
• leftHtfOffset / rightHtfOffset - HTF offsets for edges
• topPrice / bottomPrice - Price boundaries
• extendRight - Auto-extend flag
SyncedLine
Managed line with synchronization metadata.
• ln - The Pine Script line object
• htfTimeframe - Source timeframe
• htfOffset - Anchor offset
• price - Price level (horizontal lines)
• isHorizontal - Line orientation
• extendRight - Auto-extend flag
SyncedLabel
Managed label with synchronization metadata.
• lbl - The Pine Script label object
• htfTimeframe - Source timeframe
• htfOffset - Anchor offset
• price - Price level
• anchorPoint - "start", "end", or "middle"
━━━━━━━━━━━━━━━━━━━━━━━━━━━━━━━━━━━━━━━━━━━━━━━
EXPORTED FUNCTIONS
━━ CORE FUNCTIONS ━━
getTimeframeInfo(sourceTimeframe)
Analyzes relationship between a source TF and chart TF.
Returns: TimeframePair with comparison metadata
createTracker(htfTimeframe)
Creates a new HTF tracker. Call once per timeframe, store with `var`.
Returns: HTFTracker instance
updateTracker(tracker, htfTimeframe, historyDepth)
Updates tracker with current bar data. Call on every bar.
• htfTimeframe: The timeframe string (must match createTracker)
• historyDepth: Max HTF bars to track (default 500)
Returns: Updated tracker
getStartBar(tracker, htfOffset)
Gets chart bar_index where a specific HTF bar started.
• htfOffset: 0=current, 1=previous, 2=two bars ago, etc.
Returns: bar_index or na
getEndBar(tracker, htfOffset)
Gets chart bar_index where a specific HTF bar ended.
Returns: bar_index or na
htfBarChanged(tracker)
Detects when HTF bar just changed.
Returns: True on first chart bar of new HTF bar
findBarAtTime(timestamp, maxLookback)
Searches backward to find chart bar containing a timestamp.
• maxLookback: How far back to search (default 500)
Returns: bar_index or na
syncEventToChart(tracker, eventPrice, eventTime, anchorPoint)
Generic sync function mapping any event to correct chart position.
• anchorPoint: "start", "end", or "middle"
Returns: MTFEventData
━━ DRAWING CREATION FUNCTIONS ━━
syncedBox(tracker, leftHtfOffset, rightHtfOffset, topPrice, bottomPrice, bgcolor, ...)
Creates a box at correct HTF-aligned position.
• leftHtfOffset: HTF bars back for left edge
• rightHtfOffset: HTF bars back for right edge
• extendRight: Auto-extend to current bar
Returns: SyncedBox or na
syncedHLine(tracker, htfOffset, price, lineColor, lineStyle, lineWidth, extendRight)
Creates horizontal line anchored to HTF bar start.
• extendRight: If true, extends to current bar (default true)
Returns: SyncedLine or na
syncedVLine(tracker, htfOffset, atStart, lineColor, lineStyle, lineWidth)
Creates vertical line at HTF bar boundary.
• atStart: True=start of HTF bar, False=end
Returns: SyncedLine or na
syncedLabel(tracker, htfOffset, price, labelText, anchorPoint, ...)
Creates label at correct HTF-aligned position.
• anchorPoint: "start", "end", or "middle"
Returns: SyncedLabel or na
syncedPlotValue(tracker, value, htfOffset)
Returns value for plotting only at synced positions.
Returns: value if current bar is within HTF range, otherwise na
━━ UPDATE FUNCTIONS ━━
updateSyncedBox(syncedBox, extendToCurrentBar)
Extends existing box's right edge to current bar.
Returns: Updated SyncedBox
updateSyncedLine(syncedLine, extendToCurrentBar)
Extends existing horizontal line to current bar.
Returns: Updated SyncedLine
updateSyncedLabel(syncedLabel, tracker, newText, newPrice)
Updates label text/price while maintaining sync.
Returns: Updated SyncedLabel
━━ CONVENIENCE FUNCTIONS ━━
htfBarStartIndex(htfTimeframe, htfOffset, historyDepth)
Simple function to get HTF bar start without explicit tracker.
⚠️ Only tracks ONE timeframe. For multiple TFs, use createTracker pattern.
Returns: bar_index or na
htfBarEndIndex(htfTimeframe, htfOffset, historyDepth)
Simple function to get HTF bar end without explicit tracker.
⚠️ Only tracks ONE timeframe. For multiple TFs, use createTracker pattern.
Returns: bar_index or na
━━━━━━━━━━━━━━━━━━━━━━━━━━━━━━━━━━━━━━━━━━━━━━━
COMPLETE USAGE EXAMPLES
Example 1: FVG Box with Auto-Extend
```
//@version=6
indicator("FVG with Synced Drawing", overlay=true)
import ArunaReborn/TimeframeAlign/1 as tfa
htfInput = input.timeframe("60", "HTF for FVG")
// Create tracker for chosen timeframe
var tfa.HTFTracker fvgTracker = tfa.createTracker(htfInput)
tfa.updateTracker(fvgTracker, htfInput)
// Get FVG data from HTF (confirmed bars with offset)
= request.security(syminfo.tickerid, htfInput,
[low , high , low > high ],
lookahead=barmerge.lookahead_off)
// Store managed box
var tfa.SyncedBox fvgBox = na
// Create synced box when FVG detected
if fvgDetected and tfa.htfBarChanged(fvgTracker)
fvgBox := tfa.syncedBox(fvgTracker, 3, 1, fvgTop, fvgBot,
color.new(color.green, 85), color.green, 1, "FVG", color.white, true)
// Extend box to current bar each tick
if not na(fvgBox)
tfa.updateSyncedBox(fvgBox, true)
```
Example 2: HTF Support/Resistance Lines
```
//@version=6
indicator("HTF S/R Lines", overlay=true)
import ArunaReborn/TimeframeAlign/1 as tfa
htfInput = input.timeframe("240", "HTF for S/R")
// Create and update tracker
var tfa.HTFTracker srTracker = tfa.createTracker(htfInput)
tfa.updateTracker(srTracker, htfInput)
// Get HTF high/low (confirmed with offset)
= request.security(syminfo.tickerid, htfInput,
[high , low ], lookahead=barmerge.lookahead_off)
// Track lines
var tfa.SyncedLine resistanceLine = na
var tfa.SyncedLine supportLine = na
// Create new lines when HTF bar changes
if tfa.htfBarChanged(srTracker)
resistanceLine := tfa.syncedHLine(srTracker, 1, htfHigh, color.red, line.style_solid, 2, true)
supportLine := tfa.syncedHLine(srTracker, 1, htfLow, color.green, line.style_solid, 2, true)
// Auto-extend lines each bar
if not na(resistanceLine)
tfa.updateSyncedLine(resistanceLine, true)
if not na(supportLine)
tfa.updateSyncedLine(supportLine, true)
```
Example 3: Multiple Timeframes
```
//@version=6
indicator("Multi-TF Boxes", overlay=true)
import ArunaReborn/TimeframeAlign/1 as tfa
// Create separate tracker for each timeframe
var tfa.HTFTracker tracker1H = tfa.createTracker("60")
var tfa.HTFTracker tracker4H = tfa.createTracker("240")
var tfa.HTFTracker trackerD = tfa.createTracker("1D")
// Update ALL trackers every bar (pass the same TF string)
tfa.updateTracker(tracker1H, "60")
tfa.updateTracker(tracker4H, "240")
tfa.updateTracker(trackerD, "1D")
// Now use each tracker independently for drawing
// Each tracker maintains its own separate boundary history
```
━━━━━━━━━━━━━━━━━━━━━━━━━━━━━━━━━━━━━━━━━━━━━━━
NON-REPAINTING COMPLIANCE
To ensure non-repainting behavior, always use this pattern with request.security:
```
= request.security(syminfo.tickerid, htfTimeframe,
[value1 , value2 ], // Use offset for confirmed data
lookahead=barmerge.lookahead_off) // Never use lookahead_on
```
The ` ` offset ensures you're using the previous completed HTF bar, not the current forming bar.
━━━━━━━━━━━━━━━━━━━━━━━━━━━━━━━━━━━━━━━━━━━━━━━
HISTORY DEPTH PARAMETER
The `historyDepth` parameter controls how many HTF bars are tracked:
• Default: 500 HTF bars
• Maximum: Limited by Pine Script's array constraints
• Higher values = more historical accuracy but more memory usage
• Lower values = less memory but may return `na` for older offsets
Adjust based on your needs:
```
tfa.updateTracker(tracker, 100) // Track 100 HTF bars (light)
tfa.updateTracker(tracker, 1000) // Track 1000 HTF bars (heavier)
```
━━━━━━━━━━━━━━━━━━━━━━━━━━━━━━━━━━━━━━━━━━━━━━━
IMPORTANT NOTES
1. One Tracker Per Timeframe : If you need multiple HTFs, create separate trackers for each. The convenience functions (htfBarStartIndex, htfBarEndIndex) only track one TF.
2. Update Every Bar : Always call updateTracker() unconditionally on every bar, not inside conditionals.
3. HTF Only : This library is designed for Higher Timeframe data. For LTF aggregation, use findBarAtTime() for time-based lookups.
4. Drawing Limits : Pine Script has limits on drawing objects. Use box.delete(), line.delete(), label.delete() to clean up old objects.
━━━━━━━━━━━━━━━━━━━━━━━━━━━━━━━━━━━━━━━━━━━━━━━
TROUBLESHOOTING
Q: My boxes/lines still appear at wrong positions
A: Make sure you're calling updateTracker() on every bar (not inside an if statement) and using the correct htfOffset values.
Q: Functions return na
A: The htfOffset might be larger than available history. Increase historyDepth or use a smaller offset.
Q: Multiple timeframes don't work correctly
A: Don't use the convenience functions for multiple TFs. Create separate HTFTracker instances with createTracker() for each timeframe.
━━━━━━━━━━━━━━━━━━━━━━━━━━━━━━━━━━━━━━━━━━━━━━━
CHANGELOG
v1 - Initial release
• HTFTracker pattern for reliable multi-TF tracking
• Synced drawing functions for boxes, lines, labels
• Update functions for extending drawings
• Convenience functions for simple single-TF use cases

First Fvg Strategy with CHoCH Exits, Adaptive TP & Entry TimerA strategy that is purely based off of prices reaction to the first presented fair value gap at 9:30 market open. Works best on NASDAQ one minute timeframe. Experimental indicator for me to back test first presented fair value gap.

Quasimodo Pattern Strategy Back Test [TradingFinder] QM Trading🔵 Introduction
The QM pattern, also known as the Quasimodo pattern, is one of the popular patterns in price action, and it is often used by technical analysts. The QM pattern is used to identify trend reversals and provides a very good risk-to-reward ratio. One of the advantages of the QM pattern is its high frequency and visibility in charts.
Additionally, due to its strength, it is highly profitable, and as mentioned, its risk-to-reward ratio is very good. The QM pattern is highly popular among traders in supply and demand, and traders also use this pattern.
The Price Action QM pattern, like other Price Action patterns, has two types: Bullish QM and Bearish QM patterns. To identify this pattern, you need to be familiar with its types to recognize it.
🔵 Identifying the QM Pattern
🟣 Bullish QM
In the bullish QM pattern, as you can see in the image below, an LL and HH are formed. As you can see, the neckline is marked as a dashed line. When the price reaches this range, it will start its upward movement.
🟣 Bearish QM
The Price Action QM pattern also has a bearish pattern. As you can see in the image below, initially, an HH and LL are formed. The neckline in this image is the dashed line, and when the LL is formed, the price reaches this neckline. However, it cannot pass it, and the downward trend resumes.
🔵 How to Use
The Quasimodo pattern is one of the clearest structures used to identify market reversals. It is built around the concept of a structural break followed by a pullback into an area of trapped liquidity. Instead of relying on lagging indicators, this pattern focuses purely on price action and how the market reacts after exhausting one side of liquidity. When understood correctly, it provides traders with precise entry points at the transition between trend phases.
🟣 Bullish Quasimodo
A bullish Quasimodo forms after a clear downtrend when sellers start losing control. The market continues to make lower lows until a sudden higher high appears, signaling that buyers are entering with strength. Price then pulls back to retest the previous low, creating what is known as the Quasimodo low.
This area often becomes the final trap for sellers before the market shifts upward. A visible rejection or displacement from this zone confirms bullish momentum. Traders usually place entries near this level, stops below the low, and targets at previous highs or the next resistance zone. Combining the setup with demand zones or Fair Value Gaps increases its accuracy.
🟣 Bearish Quasimodo
A bearish Quasimodo forms near the top of an uptrend when buyers begin to lose strength. The market continues to make higher highs until a sudden lower low breaks the bullish structure, showing that selling pressure is entering the market. Price then retraces upward to retest the previous high, forming the Quasimodo high, where breakout buyers are often trapped.
Once rejection appears at this level, it indicates a likely reversal. Traders can enter short near this area, with stop-losses placed above the high and targets near the next support or previous lows. The setup gains more reliability when aligned with supply zones, SMT divergence, or bearish Fair Value Gaps.
🔵 Setting
Pivot Period : You can use this parameter to use your desired period to identify the QM pattern. By default, this parameter is set to the number 5.
Take Profit Mode : You can choose your desired Take Profit in three ways. Based on the logic of the QM strategy, you can select two Take Profit levels, TP1 and TP2. You can also choose your take profit based on the Reward to Risk ratio. You must enter your desired R/R in the Reward to Risk Ratio parameter.
Stop Loss Refine : The loss limit of the QM strategy is based on its logic on the Head pattern. You can refine it using the ATR Refine option to prevent Stop Hunt. You can enter your desired coefficient in the Stop Loss ATR Adjustment Coefficient parameter.
Reward to Risk Ratio : If you set Take Profit Mode to R/R, you must enter your desired R/R here. For example, if your loss limit is 10 pips and you set R/R to 2, your take profit will be reached when the price is 20 pips away from your entry point.
Stop Loss ATR Adjustment Coefficient : If you set Stop Loss Refine to ATR Refine, you must adjust your loss limit coefficient here. For example, if your buy position's loss limit is at the price of 1000, and your ATR is 10, if you set Stop Loss ATR Adjustment Coefficient to 2, your loss limit will be at the price of 980.
Entry Level Validity : Determines how long the Entry level remains valid. The higher the level, the longer the entry level will remain valid. By default it is 2 and it can be set between 2 and 15.
🔵 Results
The following examples show the backtest results of the Quasimodo (QM) strategy in action. Each image is based on specific settings for the symbol, timeframe, and input parameters, illustrating how the QM logic can generate signals under different market conditions. The detailed configuration for each backtest is also displayed on the image.
⚠ Important Note : Even with identical settings and the same symbol, results may vary slightly across different brokers due to data feed variations and pricing differences.
Default Properties of Backtests :
OANDA:XAUUSD | TimeFrame: 5min | Duration: 1 Year :
BINANCE:BTCUSD | TimeFrame: 5min | Duration: 1 Year :
CAPITALCOM:US30 | TimeFrame: 5min | Duration: 1 Year :
NASDAQ:QQQ | TimeFrame: 5min | Duration: 5 Year :
OANDA:EURUSD | TimeFrame: 5min | Duration: 5 Year :
PEPPERSTONE:US500 | TimeFrame: 5min | Duration: 5 Year :

Buyside & Sellside Liquidity The Buyside & Sellside Liquidity Indicator is an advanced Smart Money Concepts (SMC) tool that automatically detects and visualizes liquidity zones and liquidity voids (imbalances) directly on the chart.
🟢 Function and meaning:
1. Buyside Liquidity (green):
Highlights price zones above current price where short traders’ stop-loss orders are likely resting.
When price sweeps these areas, it often indicates a liquidity grab or stop hunt.
👉 These zones are labeled with 💵💰 emojis for a clear visual cue where smart money collects liquidity.
2. Sellside Liquidity (red):
Highlights zones below the current price where long traders’ stop-losses are likely placed.
Once breached, these often signal a potential reversal upward.
👉 The 💵💰🪙 emojis make these liquidity targets visually intuitive on the chart.
3. Liquidity Voids (bright areas):
Indicate inefficient price areas, where the market moved too quickly without filling orders.
These zones are often revisited later as the market seeks balance (fair value).
👉 Shown as light shaded boxes with 💰 emojis to emphasize imbalance regions.
💡 Usage:
• Helps spot smart money manipulation and stop hunts.
• Marks potential reversal or breakout zones.
• Great for traders applying SMC, ICT, or Fair Value Gap strategies.
✨ Highlight:
Dollar and money bag emojis (💵💰🪙💸) are integrated directly into chart labels to create a clear and visually engaging representation of liquidity areas.

Scalping Strategy: FVG + Engulfing
This is a scalping strategy based on the Fair Value Gap (FVG) and Engulfing pattern confirmation. It identifies the high and low of the first 5-minute candle after the 9:30 AM EST market open and waits for a breakout supported by a Fair Value Gap. A trade is only triggered after a retest of the FVG zone followed by an engulfing candle in the direction of the breakout. Trades are entered with a fixed 3:1 risk-to-reward ratio and limited to 2 entries per trading day to avoid overtrading. Ideal for NASDAQ scalping on a 1-minute chart.

GapFinder & TrapFinderGapFinder Pro is a comprehensive gap detection and trap zone analysis tool designed for traders who understand that unfilled gaps act as price magnets. This indicator automatically identifies, tracks, and monitors price gaps while alerting you to potential bull and bear traps.
Gaps represent areas where price moved so quickly that no transactions occurred—leaving behind "fair value gaps" that price often returns to fill. This indicator makes tracking these opportunities effortless.

UTS CORE + BOS + CHOCH – RR/TP/SL 📊 Indicator Working Principle
### 🔹 1. BOS (Break of Structure)
* **Definition:** Occurs when the price breaks the previous swing high or swing low level.
* **Interpretation:**
* If the last high is broken upwards → **Bullish BOS** (confirmation of uptrend).
* If the last low is broken downwards → **Bearish BOS** (confirmation of downtrend).
---
### 🔹 2. CHOCH (Change of Character)
* **Definition:** Indicates a trend reversal.
* **Interpretation:**
* In an uptrend, if the last low is broken downwards → **CHOCH↓** (start of downtrend).
* In a downtrend, if the last high is broken upwards → **CHOCH↑** (start of uptrend).
* **Chart:** Blue “CHOCH↑” labels on the chart mark trend reversals.
---
### 🔹 3. FVG (Fair Value Gap)
* **Definition:** A price gap formed between 3 candles.
* **Logic:**
* If the low of one candle stays above the high of the candle two bars back, a gap is created.
* Price tends to return to these gaps to “fill” them.
* **Chart:** The indicator highlights these gaps automatically (green/purple lines).
---
### 🔹 4. Signal Generation (BUY / SELL)
* A valid BOS or CHOCH confirmation + presence of FVG → **signal is triggered.**
* **Rules:**
* Upward break → **BUY signal**
* Downward break → **SELL signal**
* **Chart:** Red “SELL” and green “BUY” labels represent these trade signals.
---
### 🔹 5. RR – TP/SL Management
* When a trade is opened, the indicator automatically calculates **Entry, Stop Loss (SL), and Take Profits (TP1, TP2, TP3).**
* **Risk/Reward ratios:**
* TP1 = 1R
* TP2 = 2R
* TP3 = 3R
* If TP1 is hit and “Breakeven” option is enabled → SL moves to entry (risk-free trade).
---
👉 In short: this indicator tracks **market structure (BOS/CHOCH)**, detects **imbalances (FVG)**, and combines them with **risk/reward management (TP/SL)** to give you a ready-made trade

RXTrend█ OVERVIEW
The "RXTrend" indicator is a technical analysis tool based on a unique approach to trend identification using RSI values from overbought and oversold zones. Designed for traders seeking a precise tool to identify key market levels and trend direction, the indicator offers flexible settings, dynamic trend lines, candlestick coloring, and buy/sell signals, supported by alerts for key events.
█ CONCEPTS
"RXTrend" leverages the Relative Strength Index (RSI) to identify overbought and oversold zones, which are often significant areas on the chart due to potentially higher volume, increased volatility, or acting as pivot points. To address this, I created an indicator that uses RSI values from these zones, mapping them to price levels to determine the trend. Additionally, for a clearer market picture, boxes are added to highlight overbought and oversold zones on the chart, and candlestick coloring is based on the direction of the RSI moving average. This provides further confirmation of the trend direction and identifies potential correction or reversal points. The indicator is universal and works across all markets (stocks, forex, cryptocurrencies) and timeframes.
█ FEATURES
- RSI Calculation: Calculates RSI based on the closing price over a specified period, with a default length of 14.
- Trend Line: A smoothed trend line based on mapping RSI values from overbought (for downtrends) or oversold (for uptrends) zones to price levels. RSI values are transformed into prices using the price range from a selected period (default: 50 bars) and then smoothed to form the trend line. The line changes color based on the trend direction (blue for uptrend, orange for downtrend).
- Candlestick Coloring: Option to color candles based on the direction of the RSI moving average (RSI MA). Candle colors align with the trend and box colors (blue for uptrend, orange for downtrend, gray for neutral).
- Overbought and Oversold Zones: Identifies overbought (RSI > OB) and oversold (RSI < OS) levels, drawing dynamic boxes on the price chart to reflect these zones. Boxes update in real-time, adjusting to new highs and lows.
- Buy and Sell Signals: Generates buy signals (blue "Buy" labels) when the price crosses above the smoothed oversold line and sell signals (orange "Sell" labels) when the price crosses below the smoothed overbought line.
- Shadow Fill: Option to fill the space between the trend line and price (HL2) with adjustable transparency, aiding visual trend assessment.
Alerts: Built-in alerts for:
- Buy and sell signals.
- Appearance of new overbought/oversold boxes.
- RSI MA direction change (candle color change to uptrend or downtrend).
Customization: Allows adjustment of RSI length, overbought/oversold levels, smoothing period, colors, box and label transparency, and the option to keep boxes after RSI returns to normal.
█ HOW TO USE
Add to Chart: Apply the indicator to your TradingView chart via the Pine Editor or Indicators menu.
Configure Settings:
RSI Settings:
- RSI Length: Sets the RSI calculation period (default: 14).
- Overbought Level (OB): Sets the overbought threshold (default: 70).
- Oversold Level (OS): Sets the oversold threshold (default: 30).
Price Settings:
- Price Range Lookback: Defines the period for calculating the price range (default: 50).
Candle Coloring:
- Color Candles: Enables/disables candle coloring based on RSI MA direction.
- RSI MA Length: Sets the RSI moving average period (default: 21).
Smoothing Settings:
- Smoothing Length: Degree of trend line smoothing (default: 5).
Colors:
- Trend Colors: Customize colors for uptrend (default: blue), downtrend (default: orange), and shadow fill.
Box Settings:
- Box Transparency: Adjusts box transparency (0-100).
- Box Colors: Sets colors for overbought (orange) and oversold (blue) zones.
- Keep Boxes: Determines if boxes remain after RSI returns to normal.
Signals:
- Show Buy/Sell Signals: Enables/disables signal label display.
- Label Transparency: Adjusts signal label transparency.
Interpreting Signals:
- Trend Line: Shows market direction (blue for uptrend, orange for downtrend).
- Buy Signals: Blue "Buy" label appears when the price crosses above the smoothed oversold line, signaling a potential uptrend.
- Sell Signals: Orange "Sell" label appears when the price crosses below the smoothed overbought line, signaling a potential downtrend.
- Overbought/Oversold Boxes: Orange boxes indicate overbought zones (RSI > OB), blue boxes indicate oversold zones (RSI < OS). Boxes expand dynamically in real-time.
- Candlestick Coloring: Candle colors align with the trend and box colors, reflecting RSI MA direction.
- Alerts: Set up alerts in TradingView for buy/sell signals, new overbought/oversold boxes, or RSI MA direction changes.
- Combining with Other Tools: Use the indicator alongside support/resistance levels, Fair Value Gaps (FVG), or other indicators to confirm signals.
█ APPLICATIONS
The "RXTrend" indicator is designed to identify key market zones and trend direction, making it useful for trend-following and reversal strategies. It enables:
- Trend Confirmation: Candlestick coloring and the trend line help assess the dominant market direction, supporting entry or exit decisions. The trend line can act as a significant support/resistance level, and a price bounce from it may provide a good entry point, especially when confirmed by Fibonacci levels. Additionally, the appearance of overbought/oversold boxes combined with a change in candle color (RSI MA direction) may indicate an impending correction. This allows analysis of potential market overextension and correction endings, enabling multiple entries within a trend.
- Overbought and Oversold Zone Identification: Boxes highlight potential reversal or correction points, especially when combined with support/resistance levels or FVG.
- Signal-Based Strategies: Buy and sell signals can be used as entry points in a trend or as warnings of potential reversals.
█ NOTES
- The indicator is universal and works across all markets and timeframes due to its RSI-based and price-mapping logic.
- Adjust settings (e.g., RSI length, OB/OS levels, smoothing) to suit your trading style and timeframe.
- Use in conjunction with other technical analysis tools to enhance signal accuracy.

Immediate Rebalance ICT [TradingFinder] No Imbalances - MTF Gaps🔵 Introduction
The concept of "Immediate Rebalance" in technical analysis is a powerful and advanced strategy within the ICT (Inner Circle Trader) framework, widely used to identify key market levels.
Unlike the "Fair Value Gap," which leaves a price gap requiring a retracement for a fill, an Immediate Rebalance fills the gap immediately, representing an instant balance that strengthens the prevailing market trend. This structure allows traders to quickly spot critical price zones, capitalizing on strong trend continuations without the need for price retracement.
The "Immediate Rebalance ICT" indicator leverages this concept, providing traders with automated identification of critical supply and demand zones, order blocks, liquidity voids, and key buy-side and sell-side liquidity levels.
Through features like crucial liquidity points and immediate rebalancing areas, this tool enables traders to perform precise real-time market analysis and seize profitable opportunities.
🔵 How to Use
The Immediate Rebalance indicator assists traders in identifying reliable trading signals by detecting and analyzing Immediate Rebalance zones. By focusing on supply and demand areas, the indicator pinpoints optimal entry and exit positions.
Here’s how to use the indicator in both bearish (Supply Immediate Rebalance) and bullish (Demand Immediate Rebalance) structures :
🟣 Bullish Structure (Demand Immediate Rebalance)
In a bullish scenario, the indicator detects a Demand Immediate Rebalance formed by two consecutive bullish candles with overlapping wicks. This structure signifies an immediate demand zone, where price instantly balances within the zone, reducing the likelihood of a revisit and indicating potential upside momentum.
Zone Identification : Look for two consecutive bullish candles with overlapping wicks, forming a demand zone. This structure, due to its rapid balance, usually does not require a revisit and supports further upward movement.
Entry and Exit Levels : If price revisits this zone, percentage markers, particularly 50% and 75%, act as supportive levels, creating ideal entry points for long positions.
Example : In the second image, an example of a Demand Immediate Rebalance is shown, where overlapping bullish candle shadows indicate immediate balance, supporting the continuation of the bullish trend.
🟣 Bearish Structure (Supply Immediate Rebalance)
In a bearish setup, the indicator identifies a Supply Immediate Rebalance when two consecutive bearish candles with overlapping wicks appear. This formation signals an immediate supply zone, suggesting a high probability of trend continuation to the downside, with minimal expectation for price to retrace back to this area.
Zone Identificatio n: Look for two consecutive bearish candles with overlapping shadows. This structure forms a supply area where price is expected to continue its downtrend without revisiting the zone.
Entry and Exit Level s: Should price revisit this zone, percentage-based levels (e.g., 50% and 75%) serve as potential resistance points, optimizing entry for short positions, especially if the downtrend is expected to persist.
Example : The attached chart illustrates a Supply Immediate Rebalance, where overlapping candle shadows define this area, reassuring traders of a continued downward trend with a low likelihood of price returning to this zone.
🔵 Settings
ImmR Filter : This filter allows users to adjust the detection of Immediate Rebalance zones in four modes, from "Very Aggressive" to "Very Defensive," based on zone width. The chosen mode controls the sensitivity of Immediate Rebalance detection, allowing users to fine-tune the indicator to their trading style.
Multi Time Frame : Enabling this option allows users to set the indicator to a specific timeframe (1 minute, 5 minutes, 15 minutes, 30 minutes, 1 hour, 4 hours, daily, weekly, or monthly), broadening the perspective for identifying Immediate Rebalance zones across multiple timeframes.
🔵 Conclusion
The Immediate Rebalance indicator, based on rapid balancing zones within supply and demand areas, serves as a powerful tool for market analysis and improving trade decision-making.
By accurately identifying zones where price achieves instant balance without gaps, the indicator highlights areas likely to support strong trend continuations, exempt from common retracements.
The indicator’s use of percentage levels enables traders to pinpoint optimal entry and exit points more effectively, with levels like 50% and 75% acting as support within demand zones and resistance within supply zones. This empowers traders to ride strong trends without the worry of abrupt reversals.
Overall, the Immediate Rebalance is a reliable tool for both professional and beginner traders seeking precise methods to recognize supply and demand zones, capitalizing on consistent trends.
By choosing appropriate settings and focusing on the zones highlighted by this indicator, traders can enter trades with greater confidence and improve their risk management.

Three Bar Gap (Simple Price Action - with 1 line plot)This script is tailored towards experienced traders who prefer to view raw price charts during live execution. It searches for a three-bar pattern of what is colloquially called "fair value gap", or "imbalance" and uses a single line to plot the results. The goal is to display price in a way that is as simple as possible so that chart readers who don't prefer to add indicators on their screen will still find this indicator as an acceptable option to consider for.
From a code perspective, this script explores a new PineScript feature called UDT (user-defined types). This is an incredible update because it brings developers one step close to having the ability to create abstract data types.
█ What is price action?
Experienced traders will tell you that the chart that they use for live execution is raw, clean, and uses no indicators. They say they execute on price action, so what exactly is price action?
There is no formal definition to it, but one can agree that it implies the process of analyzing price without considering the fundamentals, without needing to know what the news was about, and without needing to know any of the Greeks (except for the desire to “seek alpha” Ha.haa...). This is not to say that price action traders are executing in their own vacuums without the need to know what is happening around the world. Surely fundamentals and financial models can be used beforehand for developing a bias for what is being traded, but it’s price-first at the moment of execution. That said, Factor (A) is Price.
Factor (B) is time-perception, it’s how the trader reads the tape. How the trader perceives price to change with respect to time is valuable information. Interpretation of "time" will be elaborated in the next section that talks about candlestick patterns detected by this script.
Putting this together, price action means the analysis of price movement by only considering (A) price, and (B) time, to predict which direction the market will move. A speculative trader is timing the market with the expectation to make a quick in-and-out profit; she/she is using price action. On the other hand, a long term investor holding a diversified portfolio with a strategy based on modern portfolio theory combined with fundamental analysis (at this point candlesticks are irrelevant) but has one additional criteria of, say, can only go Long on a stock when it has closed Green on Daily; he/she is also considered to be executing on price action.
█ Candlestick patterns
This script calculates the displacement of highs and lows over three consecutive bars.
A) Down move = When High of the recent confirmed bar is lower than the Low of the previous-previous candle
B) Up move = When Low of the recent confirmed bar is higher than the High of the previous-previous candle
(Note that its the confirmed bar that is being talked about, so it does not repaint)
An ATR filter will be applied to reduce the number of lines generated as many times they might just be associated with minor price changes.
Interpretations:
When price moves quickly across three bars, it can be thought that it has gapped. Although the candle in the middle appears to be solid, it’s not from a conceptual perspective. This is because time itself is arbitrary; timeframes don’t necessarily have to be fixed intervals. Take stocks with regular trading hours for example, if price makes a breakaway gap and you bundle the after-hours and pre-market sessions together as one candle, never minding that intervals should be fixed, then you will see the exact three-bar-gap patterns. Similar happens during intraday sessions on lower timeframes, if you zoom-in closer, you’ll see that ticks within the middle candle are sparsely dispersed. This is why it's called a gap.
█ Parameters with fixed inputs & assumptions used:
ATR is used for filtering out minor movements that will likely be deemed as irrelevant by trader for the purpose of live execution. The following inputs are required:
A) ATR lookback period
B) Multiplier
The product of ATR(len=A) and B produces a threshold for minimum distance that price must gap by. Initially, it was proposed to be only based on one ATR, but often an ATR is too wide and using it will filter out too many lines. Because of this observation, a multiplier (Parameter B) has been introduced to allow users to apply fractional ATR as a threshold.
█ Applications:
For trend followers: Follow the direction of the gap. Entering above recent high/low points above/below the first impulse with a stop-limit order is a viable tactic.
For contrarians fading a trend: The mid-point is a good point of reference for predicting potential areas of support/resistance.

LANZ Origins🔷 LANZ Origins – Multi-Framework Liquidity, Structure & Risk Management Overlay
LANZ Origins is a multi-tool TradingView indicator designed to provide session context, liquidity mapping, imbalance visualization, higher-timeframe candle projection, and a fixed-SL lot size calculator.
It includes:
Risk & Lot Size Panel (up to 5 accounts):
Calculates lot size using a fixed Stop Loss in pips and a standard pip value assumption ($10 per pip per 1.0 lot). For each enabled account, it displays the estimated lots and dollar risk based on account capital and risk %. The panel is fully customizable (colors, text size, visibility).
Session Backgrounds (New York time):
Colors the chart by time blocks: Day Division, No Action Zone, Killzone, and Hold Session, helping traders visually segment the trading day.
Asian Range Liquidity Box (19:00–02:00 NY):
Draws a dynamic box tracking the session high/low, plus an optional midline (50%) with optional label. The script correctly handles sessions that cross midnight.
Imbalance Detector:
Detects and draws Fair Value Gaps (FVG), Opening Gaps (OG), and Volume Imbalances (VI) with adjustable filters (min width by points/%/ATR and extension). Optionally shows a dashboard summarizing frequency and fill rate.
ICT HTF Candles Overlay:
Projects selected higher-timeframe candles to the right of price (e.g., 30m enabled by default), with optional labels, remaining time, trace lines (O/C/H/L) and internal imbalance highlights for those HTF candle sets.
30m ZigZag projected to all timeframes:
Computes ZigZag pivots from the 30-minute timeframe and draws them on any chart timeframe, including an optional live extending leg.
LANZ Origins does not execute trades and does not generate buy/sell entries. It is a visual framework for analysis, context, and risk planning.

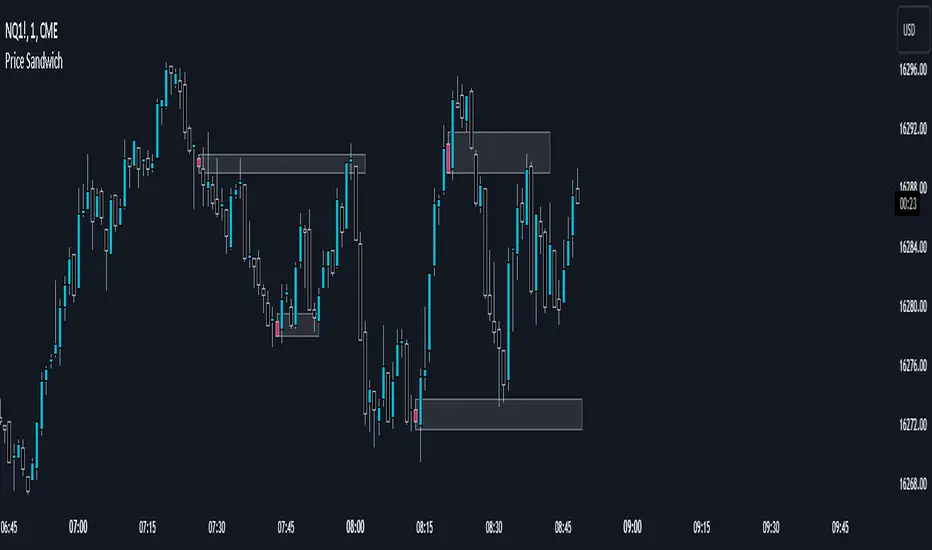
Price SandwichFor the script in question
This script acts as an indicator that a potential short term or long term trend reversal is coming. Note that not every candle can be used as an indication and the smaller ones tend to have little to no effect, however they can be used alongside orderblocks or future support/resistance areas.
The best timeframes I've found these to be useable are on the 1m, 2m, or second charts.
You may use this as an added confluence that a trend is ending either short term or long term.
You may also decide to use this with other indicators to build further confluence.
Note that this is just something I've noticed personally most likely does not apply to all trend reversals.
Some ideas on how to use it:
If you extend a rectangle out from the block itself, you can often find the next high or low overlaps with said rectangle.
They may also overlap with a fair value gap that could make that gap have more potential.
Hope this is of use and can help with that added confluence or early warning signal of a potential reversal. This should not be used alone and it's recommended to not use this as a surefire indication of whether to take a trade.//Krindler
Script Breakdown
//@version=5 // this makes the script v5 friendly
indicator("Price Sandwich", overlay=true) //makes this script an indicator, overlay=true to make it a part of the main chart
// User input for the highlight color
userColor = input(color.green, title="Highlight Color") //This allows you to choose what color you want the candle to be in the settings
//Function to check the custom candle pattern based on whether the candle is being englulfed by both preceding and latter candle.
isCustomPattern() => //let's me look for a custom candle pattern
high > high and high < high and low < low and low > low
//this checks the candle before and the candle after to check that the candle in the middle doesn't escape the range of the candle before, or the candle afters highs and lows thus making it a sandwiched candle.
//high > high and high < high and low < low and low > low basically says: candle 1 high must be greater than candle 2 high and candle 2 high must be less than candle 3 high and candle 1 low must be less than candle 2 low and candle 2 low must be greater than candle 3 low. Thus making sure that candle 2 is within the range of candle's 1 and 3 and doesn't have a high or low that is either above or below candle 1 and 3. 'and' is the operator to make sure that all of these values must be true in order for that candle to meet the criteria of getting colored.
// Apply bar color to Sandwiched candle if candle is found.
barcolor(isCustomPattern() ? userColor : na, offset=-1) //this targets the findings from isCustomPattern() and uses the user color chosen in settings and colors the middle bar by using offset=-1, otherwise it would color candle 3, so offset goes back 1 candle to color the middle candle.
If this script is already in circulation, please let me know and i'll remove it immediately. I checked but couldn't find one that did it.
FVG w/ Fibs [QuantVue]The "FVG w/ Fibs" indicator is a trading tool designed to identify and visualize Fair Value Gaps (FVGs) while overlaying two Fibonacci retracement levels.
• Bullish FVG: Occurs when the low of the current bar is higher than the high of two bars ago, and the previous close is higher than the high of two bars ago.
• Bearish FVG: Occurs when the high of the current bar is lower than the low of two bars ago, and the previous close is lower than the low of two bars ago.
The indicator filters these gaps based on user-defined criteria such as the minimum percentage size of the gap.
Once identified, these FVGs are highlighted on the chart using customizable boxes and the 50% and 61.8% (default settings) Fibonacci retracement levels are calculated and drawn based on the size of the identified FVG.
• Dynamically updates and extends the boxes as the price evolves.
• Alerts / visual changes for FVGs that get filled.
• User option for fills by Wicks or Close
• User-customizable settings for box colors, styles, and Fibonacci level appearances
Give this indicator a BOOST and COMMENT your thoughts!
We hope you enjoy.
Cheers!

ICT 1st Pres. FVGs & RTH Open Gaps version 13/01/2026
ICT 1st Pres. FVGs & RTH Open Gaps
By Timo Haapsaari (@hqtimppa) based on ICT (Inner Circle Trader / Michael J.
Huddleston) teachings.
This indicator identifies and displays:
• First Presented Fair Value Gaps (FVGs) after Midnight Open (00:00 NY)
• First Presented FVGs after NY Open (09:30 NY)
• Regular Trading Hours (RTH) Opening Gaps (16:14 close vs 09:30 open)
All detections are based on 1-minute data for accuracy across any timeframe.
Special thanks to cephxs (https:x.com/dyk_ceph) for inspiration on settings
structure and visual appearance.
Happy trading! 📈

FVG Scanner CareCA Fair Value Gap detection indicator that identifies institutional order flow imbalances by highlighting price gaps where buyers or sellers overwhelmingly dominated. It marks bullish FVGs (green gaps where buyers controlled) and bearish FVGs (red gaps where sellers controlled), providing clear visual zones for potential support/resistance retests and institutional entry points.
Perfect for identifying smart money footprints and combining with other indicators to find high-probability reversal zones during scalping.

ICT Visible Center-Label CISD & FVGsThis indicator provides a clean, institutional-grade view of market shifts and liquidity gaps, specifically optimized for ICT (Inner Circle Trader) concepts.
Core Components
CISD (+/-): Identifies a "Change in State of Delivery." A (+) indicates a bullish shift, while a (-) indicates a bearish shift. These appear as fixed black lines with labels that delete automatically once price breaches the level.
Multi-Timeframe FVGs: Automatically plots Fair Value Gaps from the 5m, 15m, 1H, and 4H timeframes simultaneously.
Center-Locked Labels: Timeframe labels (e.g., "1H") are centered within the gaps, making them easy to identify without scrolling back through price history.
Auto-Cleaning Logic: To keep your chart clutter-free, gaps and CISD levels are instantly removed from the screen the moment they are mitigated (filled) by price.

Liquidity Void and Repair EngineLiquidity Void & Repair Engine
OVERVIEW
The Liquidity Void & Repair Engine is a high-fidelity institutional order flow tool designed to identify and track "Market Imbalances" or "Fair Value Gaps" (FVG). Unlike standard gap indicators that clutter the chart with every minor price jump, this engine uses Volatility-Adjusted Range Mapping to isolate high-conviction voids where price moved so rapidly that liquidity was left "unfilled."
The standout feature of this tool is its Active Repair Logic. The engine doesn't just draw static boxes; it monitors price action in real-time to determine when an imbalance has been "healed" by subsequent trading volume, providing a dynamic look at where the market has "unfinished business."
TECHNICAL LOGIC & ORIGINALITY
This script is published Open Source to contribute to the Pine Script community’s understanding of dynamic object management and order flow visualization.
ATR-Relative Filtering: To ensure only significant voids are plotted, the script uses a user-defined ATR (Average True Range) multiplier. This filters out market noise and focuses on institutional "impulse" moves.
Dynamic Box Management: Utilizing the Pine Script box array system, the script manages memory efficiently by updating existing objects rather than creating redundant ones.
The "Repair" Algorithm: The script tracks the high and low of every active void. When price action fully traverses the coordinates of a void, the script "seals" the box, visually marking the moment of liquidity equilibrium.
HOW TO USE
1. Identifying the "Magnet" (The Void)
When price moves aggressively, it leaves a "hole" in the auction.
Bullish Voids (Green): These represent areas where price surged so fast that buyers may still have unfilled orders sitting below. These act as Magnets for pullbacks.
Bearish Voids (Red): These represent areas where price plummeted, leaving a vacuum of selling pressure. These act as Magnets for relief rallies.
2. Trading the "Repair" Process
The Engine tracks how the market "repairs" these holes:
Partial Fill: If price enters a box but doesn't cross it, the "Magnet" is still active.
Full Repair: When a box is "sealed" (stops extending right), it indicates the imbalance is gone. If price "Seals" a green box and then bounces, it confirms the zone as Valid Institutional Support.
3. Confluence with the Trend
Continuation: In a strong uptrend, look for price to drop into a Green Bullish Void and find support. This is often the "Golden Entry" for trend followers.
Reversal Confirmation: If price ignores a Red Bearish Void and blasts right through it (sealing it instantly), it signals a massive shift in market regime and extreme bullish conviction.
USER SETTINGS
Lookback Period: How far back the engine searches for un-repaired gaps.
Min Gap Size (ATR %): Increase this to see only the "Major" institutional gaps; decrease it for a more granular intraday look.
Visual Styles: Fully customizable colors and transparency to match any chart theme (Dark/Light).
NOTES & DISCLAIMER
This script is a visualization of historical price imbalances and is intended for educational purposes only. It does not provide trade signals, entry/exit points, or financial advice. All trading involves risk.

First Presented FVGSummary: First Presented FVG Indicator
This is a Pine Script v6 TradingView indicator that identifies and visualizes the first Fair Value Gap (FVG) that forms within configurable time windows during a trading session.
What it Does
1. Detects FVGs : Uses the classic 3-candle FVG definition:
- Bullish FVG: When low > high (gap up)
- Bearish FVG: When high < low (gap down)
2. "First Presented" Logic : For each configured time slot, it captures only the first qualifying FVG that forms—subsequent FVGs in that window are ignored.
3. Visual Display :
- Draws a colored box spanning from detection time to session end
- Optional text label showing detection time (e.g., "9:38 Tue FP FVG")
- Optional grade lines at 25%, 50%, and 75% levels within the FVG
Key Configuration
Setting Description
Timeframe Only works on 5-minute charts or lower
Timezone IANA timezone for session times (default: America/New_York)
Session Futures trading hours (default: 1800-1715)
Min FVG Size Minimum gap size in ticks to qualify
4 Time Slots Each with enable toggle, time window, and color
Default Time Slots
Slot 1 (enabled): 09:30-10:30 — lime green
Slot 2 (enabled): 13:30-14:30 — blue
Slot 3 (disabled): 13:00-13:30 — teal
Slot 4 (disabled): 14:15-14:45 — fuchsia
Technical Features
Handles cross-midnight sessions correctly
Resets all drawings at each new session
Skips the first bar of each window to ensure valid 3-candle lookback
Clamps slot windows to session boundaries
